Clean cooking
From Project Drawdown
Clean cooking is one of the clearest examples of how climate solutions can also improve human health and well-being. While clean cooking technology is taken for granted in most high-income countries, many parts of the world still use wood, coal, or other dirty fuels for daily cooking. When those polluting cooking fuels are replaced with electricity (or, in the short term, other fuels), it not only reduces the amount of greenhouse gases spewing into the atmosphere but also dramatically increases household air quality and allows women and girls, as the primary fuelwood collectors, to spend their time elsewhere, such as paid work or education.
Learn more about the benefits of clean cooking, as well as how and where it can best be implemented, in the Drawdown Explorer and our policy brief.
Deploy Clean Cooking
We define the Deploy Clean Cooking solution as the use of cleaner cooking fuels (liquid petroleum gas, natural gas, electricity, biogas, and ethanol) in place of polluting fuels such as wood, charcoal, dung, kerosene, and coal, and/or the use of efficient cookstove technologies (together called cleaner cooking solutions). Replacing unclean fuel and cookstoves with cleaner approaches can drastically reduce GHGemissions while offering health and biodiversity benefits.
Last updated September 22, 2025
Overview
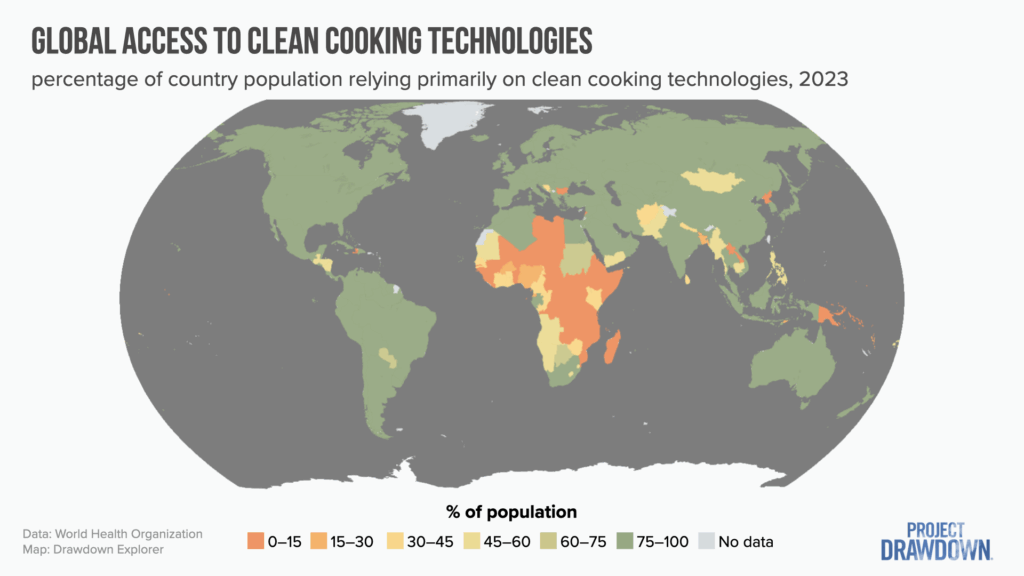
Worldwide, cooking is responsible for an estimated 1.7 Gt CO₂‑eq/yr (100-yr basis), (World Health Organization [WHO], 2023), or almost 3% of annual global emissions. Most of these emissions come from burning nonrenewable biomass fuels. Only the CO₂‑eq on a 100-yr basis is reported here due to lack of data on the relative contributions of GHGs. The International Energy Agency (IEA, 2023a) states that 2.3 billion people in 128 countries currently cook with coal, charcoal, kerosene, firewood, agricultural waste, or dung over open fires or inefficient cookstoves because they do not have the ability to regularly cook using cleaner cooking solutions. Even when sustainably harvested, biomass fuel is not climate neutral because it emits methane and black carbon (Smith, 2002).
Clean cooking (Figure 1) reduces GHG emissions through three pathways:
Improving Efficiency
Traditional biomass or charcoal cookstoves are less than 15% efficient (Khavari et al., 2023), meaning most generated heat is lost to the environment rather than heating the cooking vessel and food. Cleaner fuels and technologies can be many times more efficient, using less energy to prepare meals than traditional fuels and cookstoves (Kashyap et al., 2024).
Reducing Carbon Intensity
Cleaner fuels have lower carbon intensity, producing significantly fewer GHG emissions per unit of heat generated than conventional fuels. Carbon intensity includes CO₂, methane, and nitrous oxide as well as black carbon. For instance, charcoal cookstoves emit approximately 572 kg CO₂‑eq /GJ of heat delivered for cooking (Cashman et al., 2016). In contrast, liquefied petroleum gas (LPG) and biogas emit about 292 and 11 kg CO₂‑eq /GJ, respectively (Cashman et al., 2016) and, excluding the embodied carbon, stoves that heat with electricity generated from renewableenergy sources such as solar, wind, or hydroelectric have zero emissions.
Reducing Deforestation
Cleaner cooking also helps mitigate climate change by reducing deforestation (Clean Cooking Alliance [CCA], 2023) and associated GHG emissions.
Figure 1. Classification of household cooking fuels as clean (green) and polluting (orange). Adapted from Stoner et al. (2021).
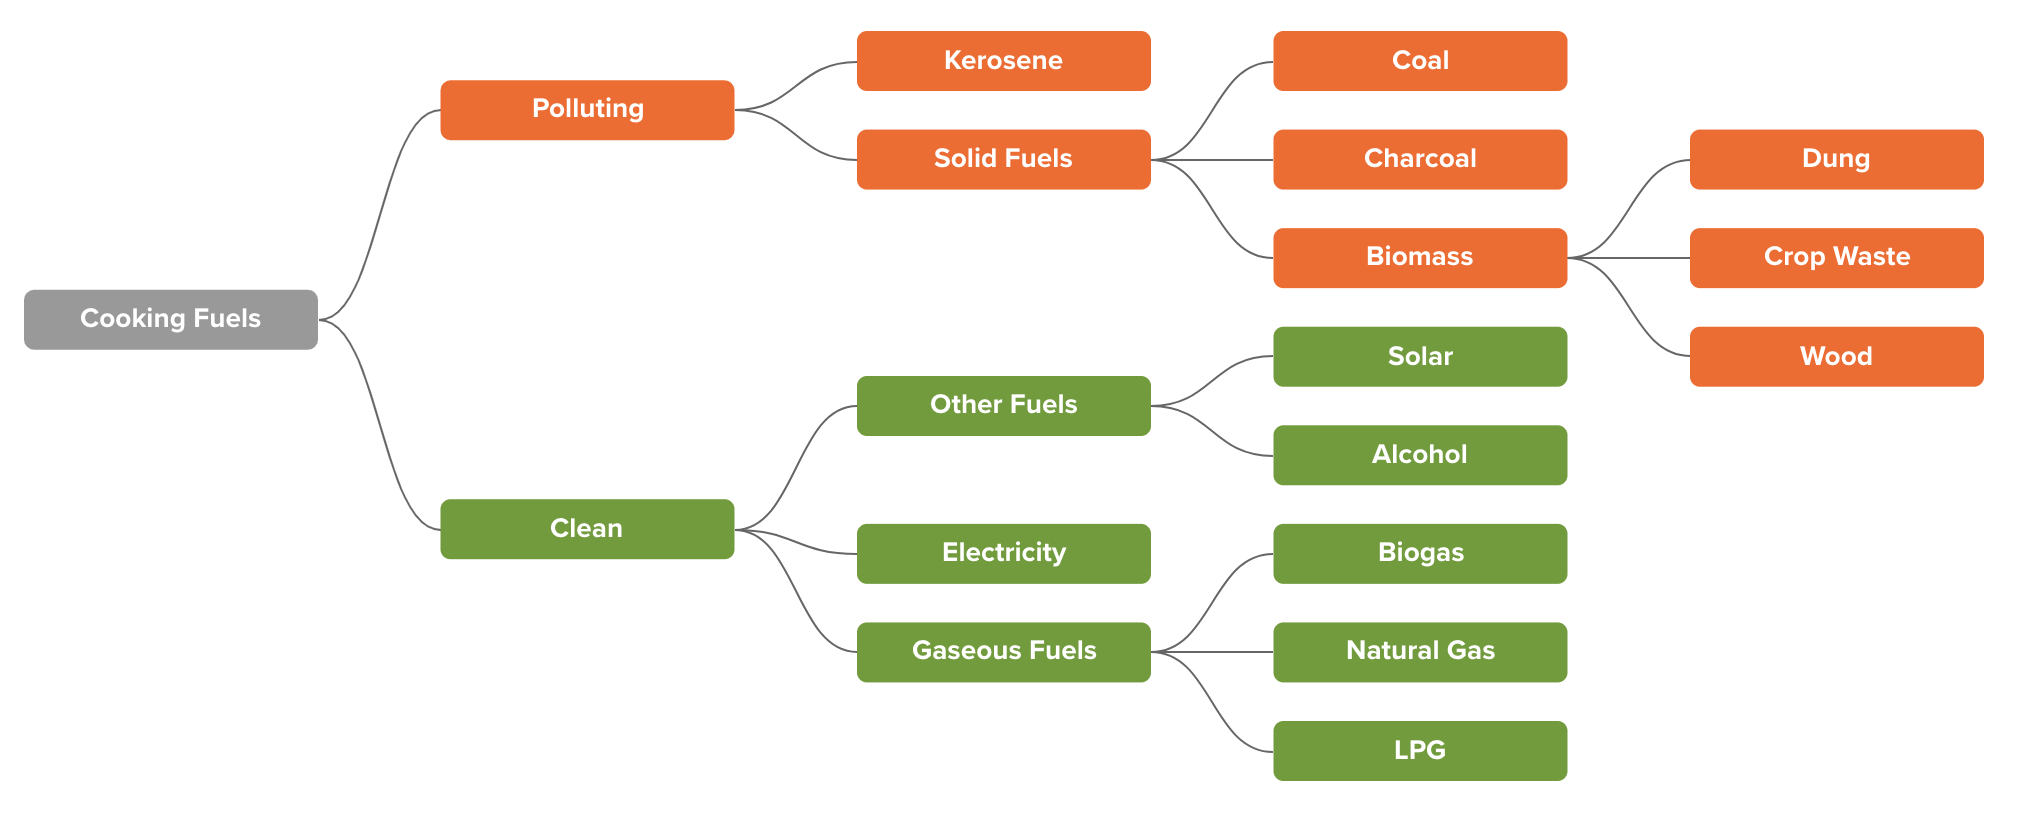
Source: Stoner, O., Lewis, J., Martínez, I. L., Gumy, S., Economou, T., & Adair-Rohani, H. (2021). Household cooking fuel estimates at global and country level for 1990 to 2030. Nature communications, 12(1), 5793.https://www.nature.com/articles/s41467-021-26036-x