Wind power has cut £104bn from UK energy costs since 2010, study finds
Reduction comes from energy generated from windfarms and lower cost of gas owing to lower demand
Fiona Harvey Environment editor Tue 28 Oct 2025 The Guardian
Wind power has cut at least £104bn from energy costs in the UK since 2010, a study has found.
Users of gas have been among the biggest beneficiaries
Users of gas have been among the biggest beneficiaries, the research suggested.
Research by University College London found that from 2010 to 2023, energy from windfarms resulted in electricity bills being lower by about £14.2bn than they would have been if gas had been needed to generate the same amount of power.
However, the reduction in the cost of gas that could be attributed to wind generation – owing to the cut in demand and not needing to build new infrastructure – was much greater, at about £133.3bn.
reduction in the cost of gas that could be attributed to wind generation – owing to the cut in demand and not needing to build new infrastructure
Over the same period, consumers paid about £43.2bn in green subsidies, levied on electricity bills rather than gas bills. The net result was a reduction of £104.3bn in UK energy bills over the 13-year period, according to the researchers.
Surging renewable energy generation across Europe made demand for gas – and thus gas prices – lower than they would otherwise have been, and meant electricity companies had less need to build costly new gas-fired power stations, according to the analysis. The way that the UK’s energy market works also means gas-fired power stations are in effect allowed to set the price of electricity.
The analysis applied to 2010-23, leaving out the lingering impacts of the leap in gas prices in early 2022, when Russia invaded Ukraine.
Colm O’Shea, a former hedge fund manager, now a master’s student at UCL and lead author of the report, said: “Far from being a financial burden, this study demonstrates how wind generation has consistently delivered substantial financial benefits to the UK. To put it into context, this net benefit of £104bn is larger than the additional £90bn the UK has spent on gas since 2021 as a result of rising prices related to the war in Ukraine.
wind generation has consistently delivered substantial financial benefits to the UK
“This study demonstrates why we should reframe our understanding of green investment from costly environmental subsidy to a high-return national investment.”
Mark Maslin, a professor of Earth system science at UCL, said the UK’s consumers would benefit to a greater extent if the electricity market were reformed to reflect the reality that wind generation was reducing bills. “At some stage, the UK government must decouple gas and electricity prices,” he said. “That would mean gas prices would reflect the global markets, while the electricity price would reflect the savings from wind and solar.”
Ana Musat, the director of policy at RenewableUK, the trade body for the wind sector, said: “This research highlights the long-term economic benefits for UK plc of investing in renewable energy generation. The only way to reduce energy costs for good is to minimise our exposure to volatile global fossil fuel prices and increase the share of electricity generation from clean homegrown sources.”
green investment [is].. a high-return national investment.
The government disappointed the wind industry and renewable energy advocates on Monday by setting out a lower amount of available subsidy than some had hoped for in an auction for new offshore wind capacity. Only about £1.1bn was made available in the auction.
Musat said: “The wind industry alone employs 55,000 people and this is set to double to 110,000 by 2030. Every gigawatt of offshore wind brings £2bn-£3bn in private investment to the UK. That’s why it’s so important that we procure significant volumes of new wind and solar capacity in the auction for clean power contracts, with the budget set at an ambitious level to enable us to make the most of the opportunity to stabilise the cost of energy.”
Michael Shanks, the energy minister, said: “Our competitive new auction process will allow us to buy the right amount of clean power at the right price on behalf of the British people, so we can take back control of our energy.”
Separately, analysis from the Energy and Climate Intelligence Unit thinktank found that in the 10 years since the Paris agreement was signed in 2015 there have been far greater increases in renewable energy generation than was envisaged at the time.
In 2015, BP predicted that non-fossil fuels would take a 38% share of global power generation by 2035, but already they account for 41%. Solar and wind generation today are four times what the International Energy Agency in 2015 forecast they would be.
The deployment of electric vehicles has also risen faster than expected: the 2015 target of 100m EVs on the road by 2030 is likely to be hit in two years.
Ed Miliband, the energy secretary, said: “Clean homegrown power is the right choice for families, industry and the nation for many years to come. Wind power is cheaper, cleaner and more secure than new gas – helping us bring down bills for good.
“And with a competitive new process to secure more wind in our upcoming renewables auction, we will take back control of our energy and bring the next generation of opportunity to British coastlines and heartlands.”
Modelling the long-term financial benefits of UK investment in wind energy generation
Authors
- Colm O’Shea (Department of Geography, University College London (UCL), UK and COMAC Capital LLP, UK)
- Piers Horne (COMAC Capital LLP, UK)
- Mark Maslin (University College London (UCL), UK; The United Nations University, Institute for Water, Environment and Health, Canada)
Abstract
This study presents new evidence of the financial impact of wind generation on the UK energy market, challenging the idea that sustainability, security, and affordability, are always in conflict. From 2010 to 2023, wind power delivered a net benefit of £104.3 billion to UK consumers—£14.2 billion from lower electricity prices and £133.3 billion from reduced natural gas prices, partially offset by £43.2 billion in wind energy subsidies. Our study takes a long-term modelling approach and considers the broader counterfactual of what would happen if the UK had continued to invest in gas instead of wind generation. In this scenario, the result is a significantly increased demand for gas in the regional European market, and therefore higher prices. Unlike previous short-term modelling studies, this approach highlights the longer-term financial benefit that wind has delivered to the UK consumer.
It is clear that wind generators reduce market prices, cannibalising their own revenues, creating value for others while limiting their own profitability. Wind power should be viewed as a public good—like roads or schools—where government support leads to national gains.
The current funding model, where electricity users bear the cost while gas users benefit, raises fairness concerns. Ultimately, wind investment has significantly lowered fossil fuel prices, underscoring the need for strategic, equitable energy policy that aligns with long-term national interests. Our study demonstrates that the energy transition is not a costly environmental subsidy, it is a compelling financial investment.
Keywords: wind energy, wind energy benefits, UK energy, energy security, climate change, energy modelling, financial modelling, net zero, national investment, renewable energy, natural gas prices
JUL 27 2023
GenCost verdict: Onshore wind and solar remain lowest cost generation
The latest iteration of the CSIRO’s GenCost report released last week has again highlighted that solar and onshore wind remain the lowest cost new build generation available. This remains the case even when integration costs (storage and new transmission) are factored into the overall cost modelling.
The report also quantifies the cost of global supply chain constraints which have impacted the raw material costs for manufacturing, as well as the transport costs involved in getting new generation installed. Those constraints have led to an estimated average 20 per cent increase in technology costs compared to a year ago. The capital cost of building all new generation has jumped. While the average estimated increase in technology costs is 20 per cent it ranges from 9 per cent for solar PV and up to 35 per cent for wind generation (see figure 1). There is an expectation that the current inflationary cycle impacting technologies has peaked in 2022-23, but also that it will take until 2027 to return to normal under current global climate policy commitments. It could take to 2030 if more ambitious commitments that encourage faster technology deployment are undertaken.
Figure 1: Increase in current costs of technologies

Source: CSIRO GenCost 2022-23
The differences in technology costs are based on the level of their exposure to various cost inputs.
The CSIRO assessment also considers storage costs and includes capital cost estimates for longer duration adiabatic compressed air storage (A-CAES) at 12 hours and a new estimate for concentrating solar thermal (CST) at 15 hours – both are amongst the highest cost storage technologies, along with 48-hour duration pumped hydro.
As with generation technologies, storage capital costs have increased and this is estimated to have resulted in a 13 per cent increase for one hour duration batteries and by as much as 28 per cent for 8-hour duration batteries. Pumped hydro costs are up an estimated 17 per cent.
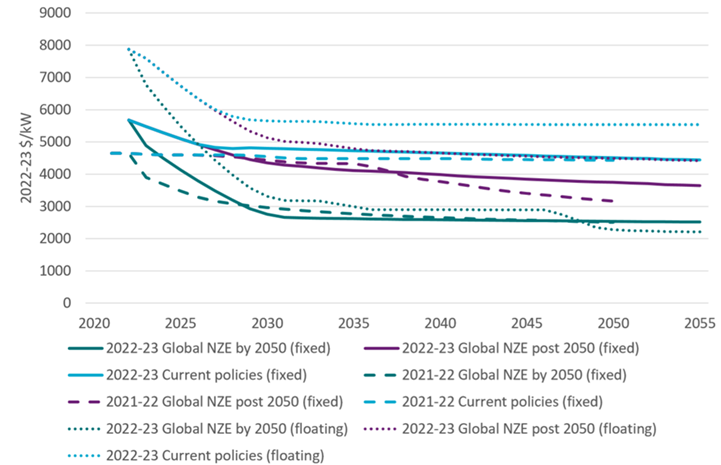
The report considers small nuclear reactors (SMRs), but only projects the technology’s costs from 2030 based on the expectation that there could not be any deployment in Australia before that date, as well as floating offshore wind technology costs. Offshore wind is relevant given current proposals for projects and the declaration of offshore wind zones in Victoria and New South Wales. Nuclear (SMR) is at the higher end of the cost curves based on current policy settings and remains a high-cost technology even under the Global Net Zero Emissions (NZE) by 2050 scenario[i]. In contrast offshore floating wind turbines are expected to come down the cost curve based on this more ambitious scenario as more turbines are installed globally. Nuclear will also require SMRS to be deployed globally and in large enough capacity to achieve economies of scale and lower capital costs.
Integration costs for renewables
Unsurprisingly the report finds that additional costs increase as renewable generation’s share grow with expenditure required on storage and transmission, particularly to strengthen existing links in the National Electricity Market (NEM). It also notes that as transmission costs assessed have been updated, saying “…they have tended to increase in cost”. Aside from the modelling this has been a notable feature of new transmission projects, such as EnergyConnect and Transgrid’s HumeLink, with the actual costs increasing beyond earlier estimates. A NSW Parliamentary inquiry was told the cost of HumeLink had increased by about 30 per cent in real terms and would now be $5 billion. EnergyConnect was originally expected to cost $1.5 billion and increased to $2.3 billion, a 50 per cent increase. Given these factors the CSIRO comments that as transmission costs are updated and have increased this has “likely led to a reduced reliance on transmission to balance supply in the modelling”.
REZ expansion costs appear to be required at similar levels for each additional 10 per cent increase in VRE share and in each state, other transmission costs (those to strengthen existing links rather than REZs) have a rising trend in the NEM with the highest expenditure in New South Wales and Victoria based on their central role in the NEM and access to pumped hydro. The cost of REZ transmission expansions adds $6-$8/MWh as renewable share increases from 60 to 90 per cent; other transmission adds $5-$6/MWh with costs accelerating as renewables increase. Storage adds $9-$14/MWh. Based on previous estimates of transmission costs and actual outcomes, these are likely to increase beyond these figures.
The CSIRO has calculated that in 2030 the NEM will need to have 0.26kW to 0.39kW of storage capacity for each kW of variable renewable generation installed
Overall integration to support renewables are estimated to be $25-34/MWh. Figure 3 shows the changes in the costs of various technologies to support renewables as their share of capacity increases in the NEM, while figure 3 shows the LCOE for various technologies and renewables, including their integration costs.
Figure 2: Levelised costs of achieving 60%, 70%, 80% and 90% annual renewable energy share in NEM

Source: CSIRO GenCost 2022-23
Figure 3: LCOE of technologies 2030

Source: CSIRO GenCost 2022-23
Below we show the CSIRO’s cost assessment for major generation and energy storage technologies across various scenarios and compared to last year’s estimates.
Black coal supercritical
Figure 4: Black coal plant projected capital costs

Source: CSIRO GenCost 2022-23
Coal with CCS
Cost reductions are assumed to occur because of deployment of carbon capture and storage technology in other industries rather than in the energy sector and there is considered to be only a negligible amount of generation from this source over the CSIRO’s projection period.
Figure 5: Coal plant with CCS projected capital costs

Source: CSIRO GenCost 2022-23
Gas with CCS
The report notes that there is a relatively small pipeline of projects planned globally using this technology (30 planned which are yet to make a financial investment decision, two under construction and one completed) and advance projects are for smaller volumes and/or low capture rates. Given this the modelling assumes the earliest date for commercial, high capture projects is 2035, so meaningful cost reductions don’t occur until after that date.
Figure 6: Gas plant with CCS projected capital costs

Source: CSIRO GenCost 2022-23
Combined Cycle Gas
Figure 7: CCGT projected capital costs

Source: CSIRO GenCost 2022-23
Open Cycle Gas
Figure 8: OCGT projected capital costs

Source: CSIRO GenCost 2022-23
Nuclear SMR
Global commercial deployment of SMRs is limited to a small number of projects. Any major shift in forecast costs would depend on more aggressive emission reduction policies and greater deployment of plants.
Figure 9: Nuclear SMR projected capital costs

Source: CSIRO GenCost 2022-23
Solar Themal
Solar thermal is considered to be integrated with solar and wind, with its key role being in evening and overnight generation.
Figure 10: Solar thermal projected capital costs

Source: CSIRO GenCost 2022-23
Large-scale solar
Figure 11: Large-scale solar projected capital costs

Source: CSIRO GenCost 2022-23
Rooftop Solar
Figure 12: Rooftop Solar Projected Capital Costs

Source: CSIRO GenCost 2022-23
Onshore Wind
Figure 13: Onshore Wind Projected Capital Costs

Source: CSIRO GenCost 2022-23
Offshore wind (fixed and floating)
Figure 14: Projected costs for offshore wind – fixed and floating

Source: CSIRO GenCost 2022-23
Pumped hydro
Figure 15: PHES projected costs

Source: CSIRO GenCost 2022-23
Battery Storage
Figure 16: Battery storage projected costs
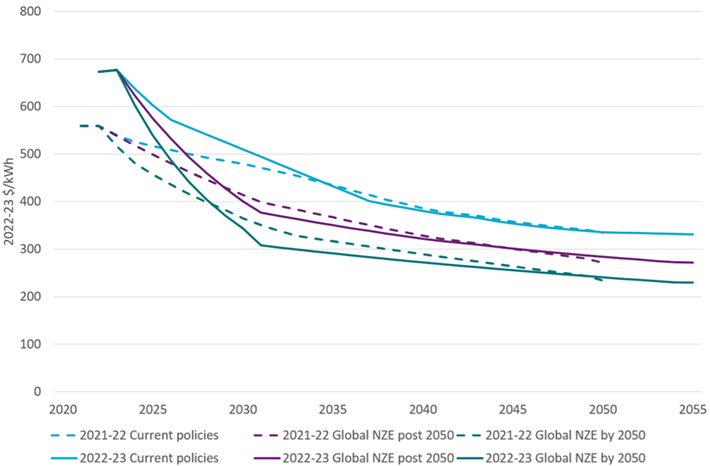
Source: CSIRO GenCost 2022-23
[i] Global NZE by 2050 is based on the International Energy Agency’s 2022 World Energy Outlook and under this scenario “there is strong climate policy consistent with maintaining temperature increases of 1.5 degrees of warming and achieving net zero emissions by 2050 worldwide. The achievement of these abatement outcomes is supported by the strongest technology learning rates and the least constrained (physically and socially) access to variable renewable energy resources”.